Pi Stats
NewReal-time Raspberry Pi monitoring dashboard — a zero-dependency Python server exposes system metrics, while a Vite + React dashboard renders them live with history charts.
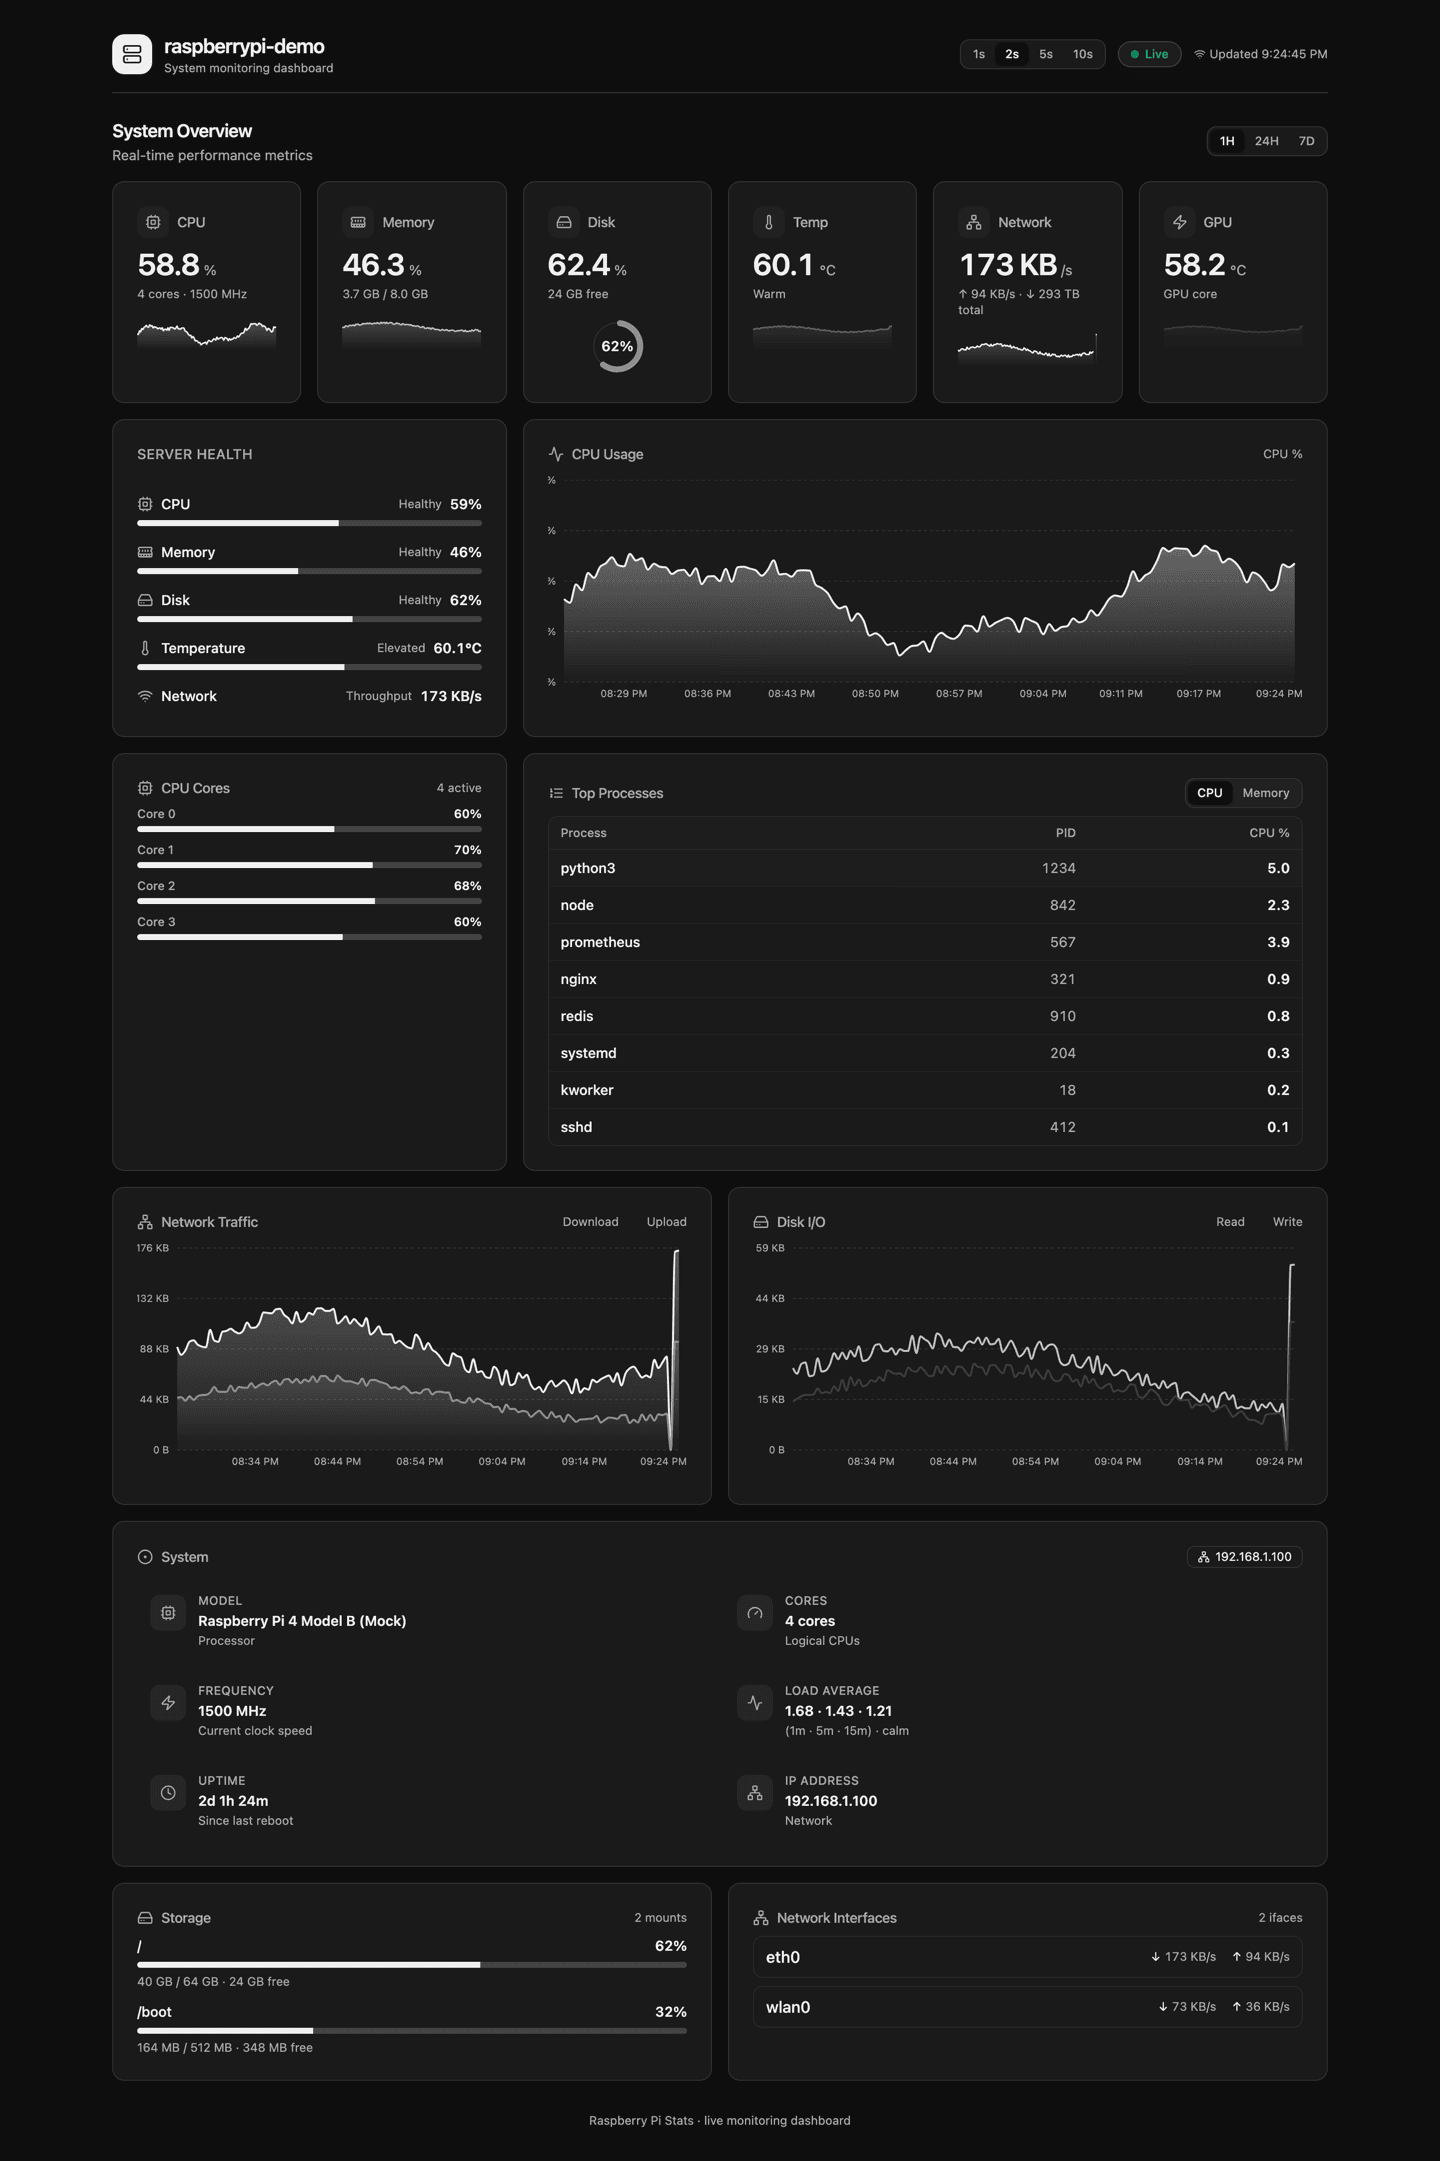
Overview
Pi Stats is a live Raspberry Pi system monitoring dashboard — Python does the sensing, React does the showing. A zero-dependency Python server (stdlib only) exposes CPU, memory, disk, temperature, network, and process metrics, while a Vite + React dashboard renders them in real time with sparklines, radial gauges, and history charts.


Features
- System Metrics: CPU usage (total + per-core), memory and swap, disk usage and I/O throughput, CPU/GPU temperature, network rx/tx per interface, and top processes — all read straight from
/proc,vcgencmd, andps. - History: A collector samples every 5 seconds into SQLite (
metrics+ hourlyrollups), with1H / 24H / 7Dtime ranges served as ~120 binned points. - Live Dashboard: Refresh interval selector, metric cards with sparklines and radial gauges, CPU/network/disk-I/O charts, server health panel, per-core grid, top-process tables, and light/dark theming.
- Zero Dependencies (Server): Built entirely on the Python 3 standard library —
http.server,sqlite3, andthreading. Nopip installrequired. - Mock Mode: Run the full stack with synthetic, time-varying data for local development or demos — no Raspberry Pi hardware needed.
- Optional Auth: HTTP Basic authentication via a single
PI_STATS_PASSWORDenvironment variable.
Tech Stack
Server:
- Python 3 stdlib only —
http.server.ThreadingHTTPServer,sqlite3,threading - Metrics from
/proc/*,statvfs,vcgencmd, andps - 5-second collector into SQLite with hourly rollups
Client:
- React 18 + TypeScript, Vite 5
- Tailwind CSS 3, Recharts,
lucide-react, shadcn/ui - Custom
useStatshook polling/api/statswith configurable intervals
API
GET /api/stats
Returns a full system snapshot: hostname, uptime, load average, IP, CPU model/cores/frequency and per-core usage, memory and swap, disk usage and I/O, temperatures, aggregate and per-interface network counters, plus top processes by CPU and memory.
GET /api/history?range=1H|24H|7D
Returns ~120 time-binned history points (30s / 12m / 35m bins) covering CPU, memory, temperature, network throughput, disk I/O, disk usage, GPU temp, and load.
All other routes serve the built React client with a path-traversal guard.
Deployment
Designed to run directly on a Raspberry Pi — one Python process serves both the API and the static client build on port 8000. Ships with systemd and crontab @reboot examples for running at boot.